InSAR
The InSAR technology (Interferometric synthetic aperture radar) is a remote sensing technique, using satellites who continuously orbit the earth with radar-instruments on board. The radar-instruments send a pulse towards the earth surface a few thousand times per second. These pulses bounce on objects on the ground and reflect back towards the satellite, where they are registered. By performing smart and complex mathematical operations on these reflected pulses, an image of the earth surface can be created, with approximately 10 000 measurements per square km.
When the satellites, via their orbit, returns to the same location again, this process can be repeated. For stable objects, such as man-made objects, signs, fences, roofs and hard surfaces, the same measuring points can be identified in several overflights. Thus, the differences in positions for the points can be compared and used to calculate how much the ground is moving. Since interferometry is applied, this displacement can be computed with a relative precision in the millimeter range.
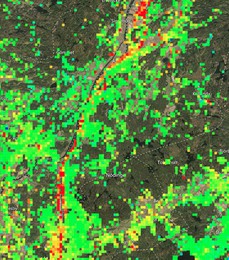
Here we use hundreds of measurments for each location. We call this data set a ”time series”. For example, we can use the time series to compute the average displacement rate, which can then be visualized in the map with a color.
Learn more:
Product specifications
Sättningskartan was created with data from the satellites Sentinel-1a and Sentinel-1b, combined with a ground based network of GNSS-receivers.
180 overflights of radar satellites is used in the map, between March 2017 and March 2021. That is an average of collecting new data every month. In total, 10.2 millions of measuring points were analysed. That means that the map contains 0.6 billions of geodetical measurments.
The measuring points consist of data from 3 separate overflights in the north direction (ascending).
Geodetical analysis
Data in Sättningskartan represent relative vertical deformations, in millimeter. On the map, these deformations are expressed as deformation rates per measuring point and indicated with a color. The displacement rates are locally referenced, since they have been adjusted for the effects of land uplift. That means, a point that is displayed as stable, green, is rising with the same rate as the land uplift on that location. The rates are also “absolute”, since they have been validated and related to gravity and GNSS measurements.
The methods and algorithms have been developed in cooperation with Delft Technical University and have been tested and validated by experts within the latest geodetic science. This is important, since these type of visualisations of ground displacement can be performed in an infinite number of ways. WSP also holds its own expertise within the field of geodesy and has developed much of the content in Sättningskartan together with SkyGeo.
Data processing
The InSAR data processing follows an algorithm developed by the Delft Technical University and SkyGeo. Data from Sentinel-1 satellites, by ESA, are used through complex numerical operations and result in estimates of deformation rates. The measured displacement rates are projected to the vertical direction and corrected for land uplift, among other systematic effects. To make the calculations efficient over such a large area, several simplifications and generalisations has been made. This results in a reduced amount of data in the map compared to what is possible and the uncertainty for the measurements is larger, both in absolute position and displacement rates.
It is important to understand that the displacement rates visualized in Sättningskartan are estimates and cannot be analysed as individual points. The map should be used to analyse trends over larger areas and over time, where clear patterns can be obsevered for many points. The map gives indications to were there is a need for further analysis.
At project specific calculations, we always take into account the client needs, interest and the local conditions on-site. With high resolution data and this background knowledge, very precise and dense results can be obtained.